The definitive tool for evaluating your tech team's performance.
Built from the analysis of thousands of tech teams, Devint turns code, deliveries and reviews into a clear score from 0 to 100.
Book a demo GitHub
 GitLab
 Bitbucket
 Jira
Jira
 Claude
 OpenAI
Managing a tech
team shouldn't
depend on guesswork.
Lines of code, hours, deliveries and reviews each show a different part of the work. Looked at in isolation, though, they don't tell the whole story.
Devint brings these signals together and turns different sources of information into a single view of performance, helping managers spot progress, points of attention and development opportunities with more clarity.


Are deliveries healthy?
Is time well managed?
Is the review enough?
Is AI being used?
But how do you turn so many signals
into a fair evaluation?
Devint combines different aspects of the work to build a complete view of performance, which results in the DevScore, our scoring system, built on 3 pillars:
Dimensions

Weights

Reference ranges
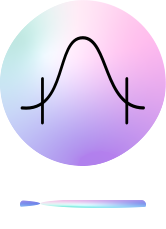
Six dimensions, one complete view
The DevScore combines the different aspects of each developer's work to arrive at a score from 0 to 100, based on configurable healthy reference ranges.
Below the healthy range, the signal is insufficient. Within it, the score grows. Above it, it saturates: extra volume does not increase the score, which reduces artificial incentives. See the example:

Delivery pace
Commits per business day and pull requests per week: is there a regular flow of reviewable delivery?

Code contribution
Alive lines and change entropy: contribution that stays in the product, not just movement.

Technical skills
Reviews from managers and the tech lead, with explicit seniority criteria.

Logged hours
Consistent time tracking: capacity, cost and predictability stop being a matter of opinion.

Behavior
Communication, predictability and accountability, assessed by direct leadership. Software is collective work.

AI and agent adoption
Real use of agents and copilots in the workflow: the company invests, Devint shows whether adoption is actually happening.
The DevScore shows
progress, not position
In a relative ranking, even when the whole team improves, someone still comes in last.
Our goal is not to create competition between teams.
Devint compares each person against stable reference ranges, not against the best colleague on the team. Collective improvement shows up as collective improvement. Biweekly closes look at the last four complete weeks: a trend reading, without the noise of atypical days and without micromanagement.
Understand what's behind every score
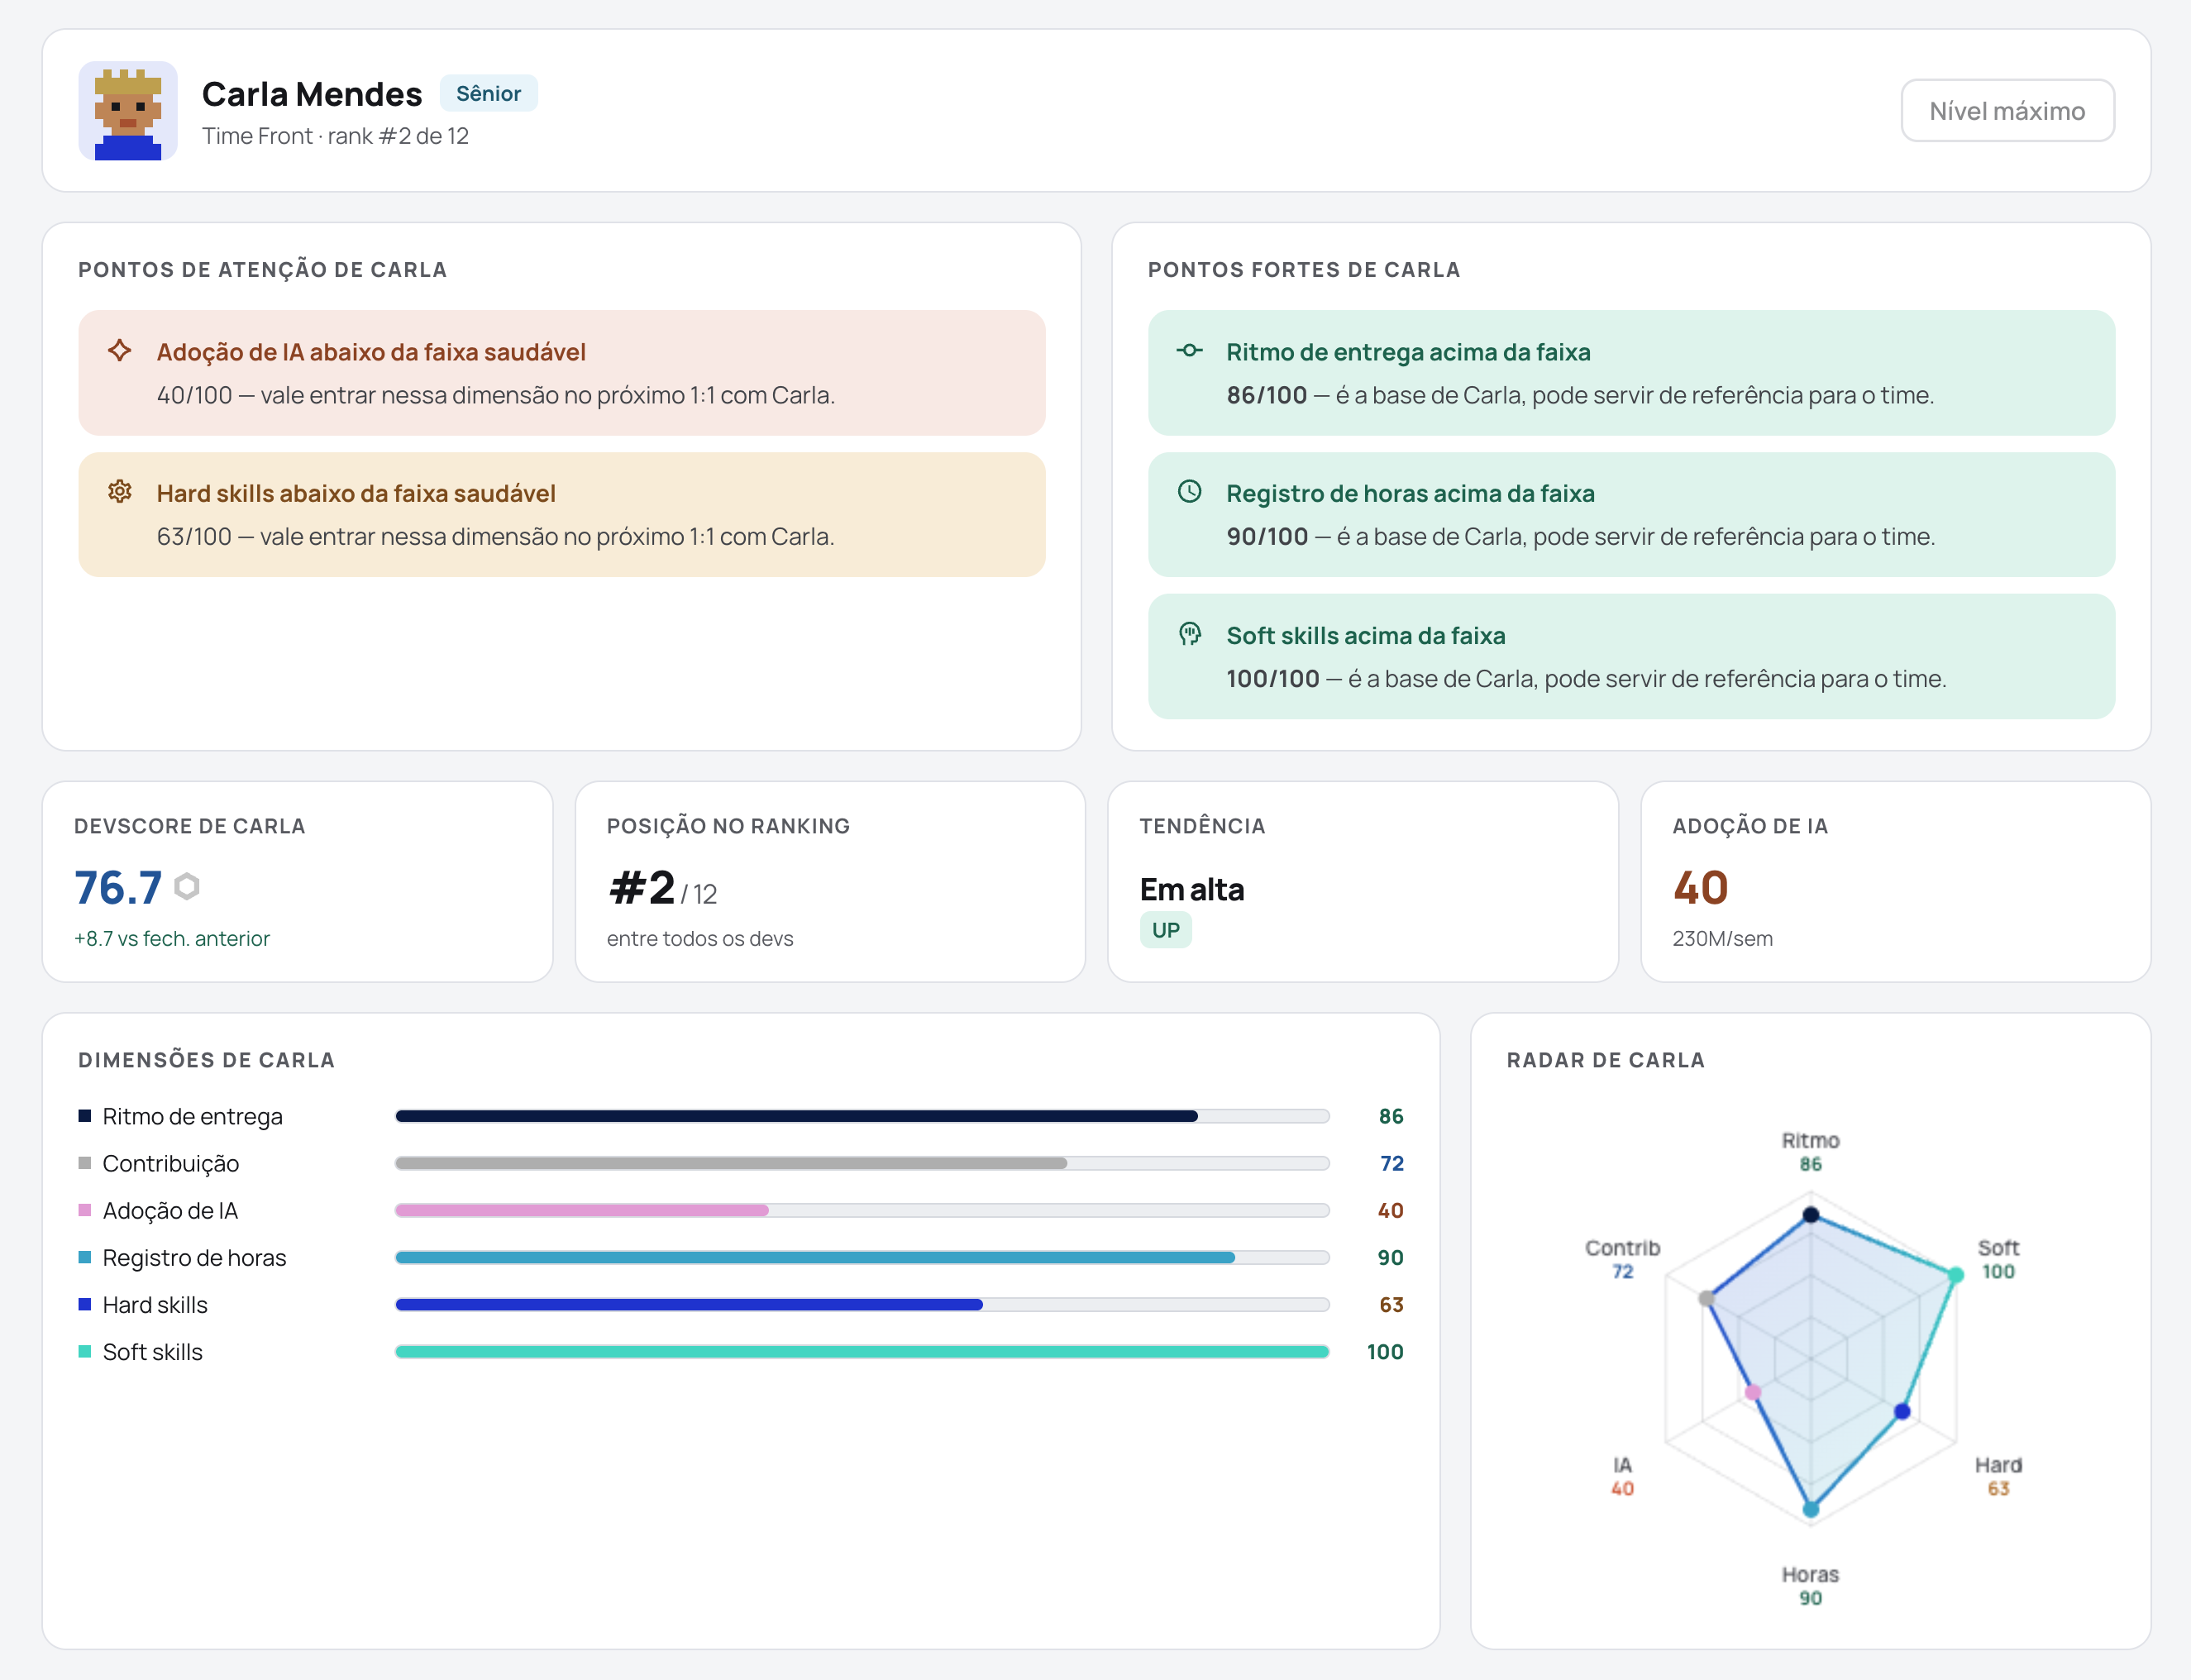
The individual profile breaks down the composition of the score: the number is never left unexplained.
- Cycle score with the change vs the previous close and position on the team.
- All six dimensions broken down, with the period's signals that support them.
- 8-week progress, cycle history, technologies and trend.
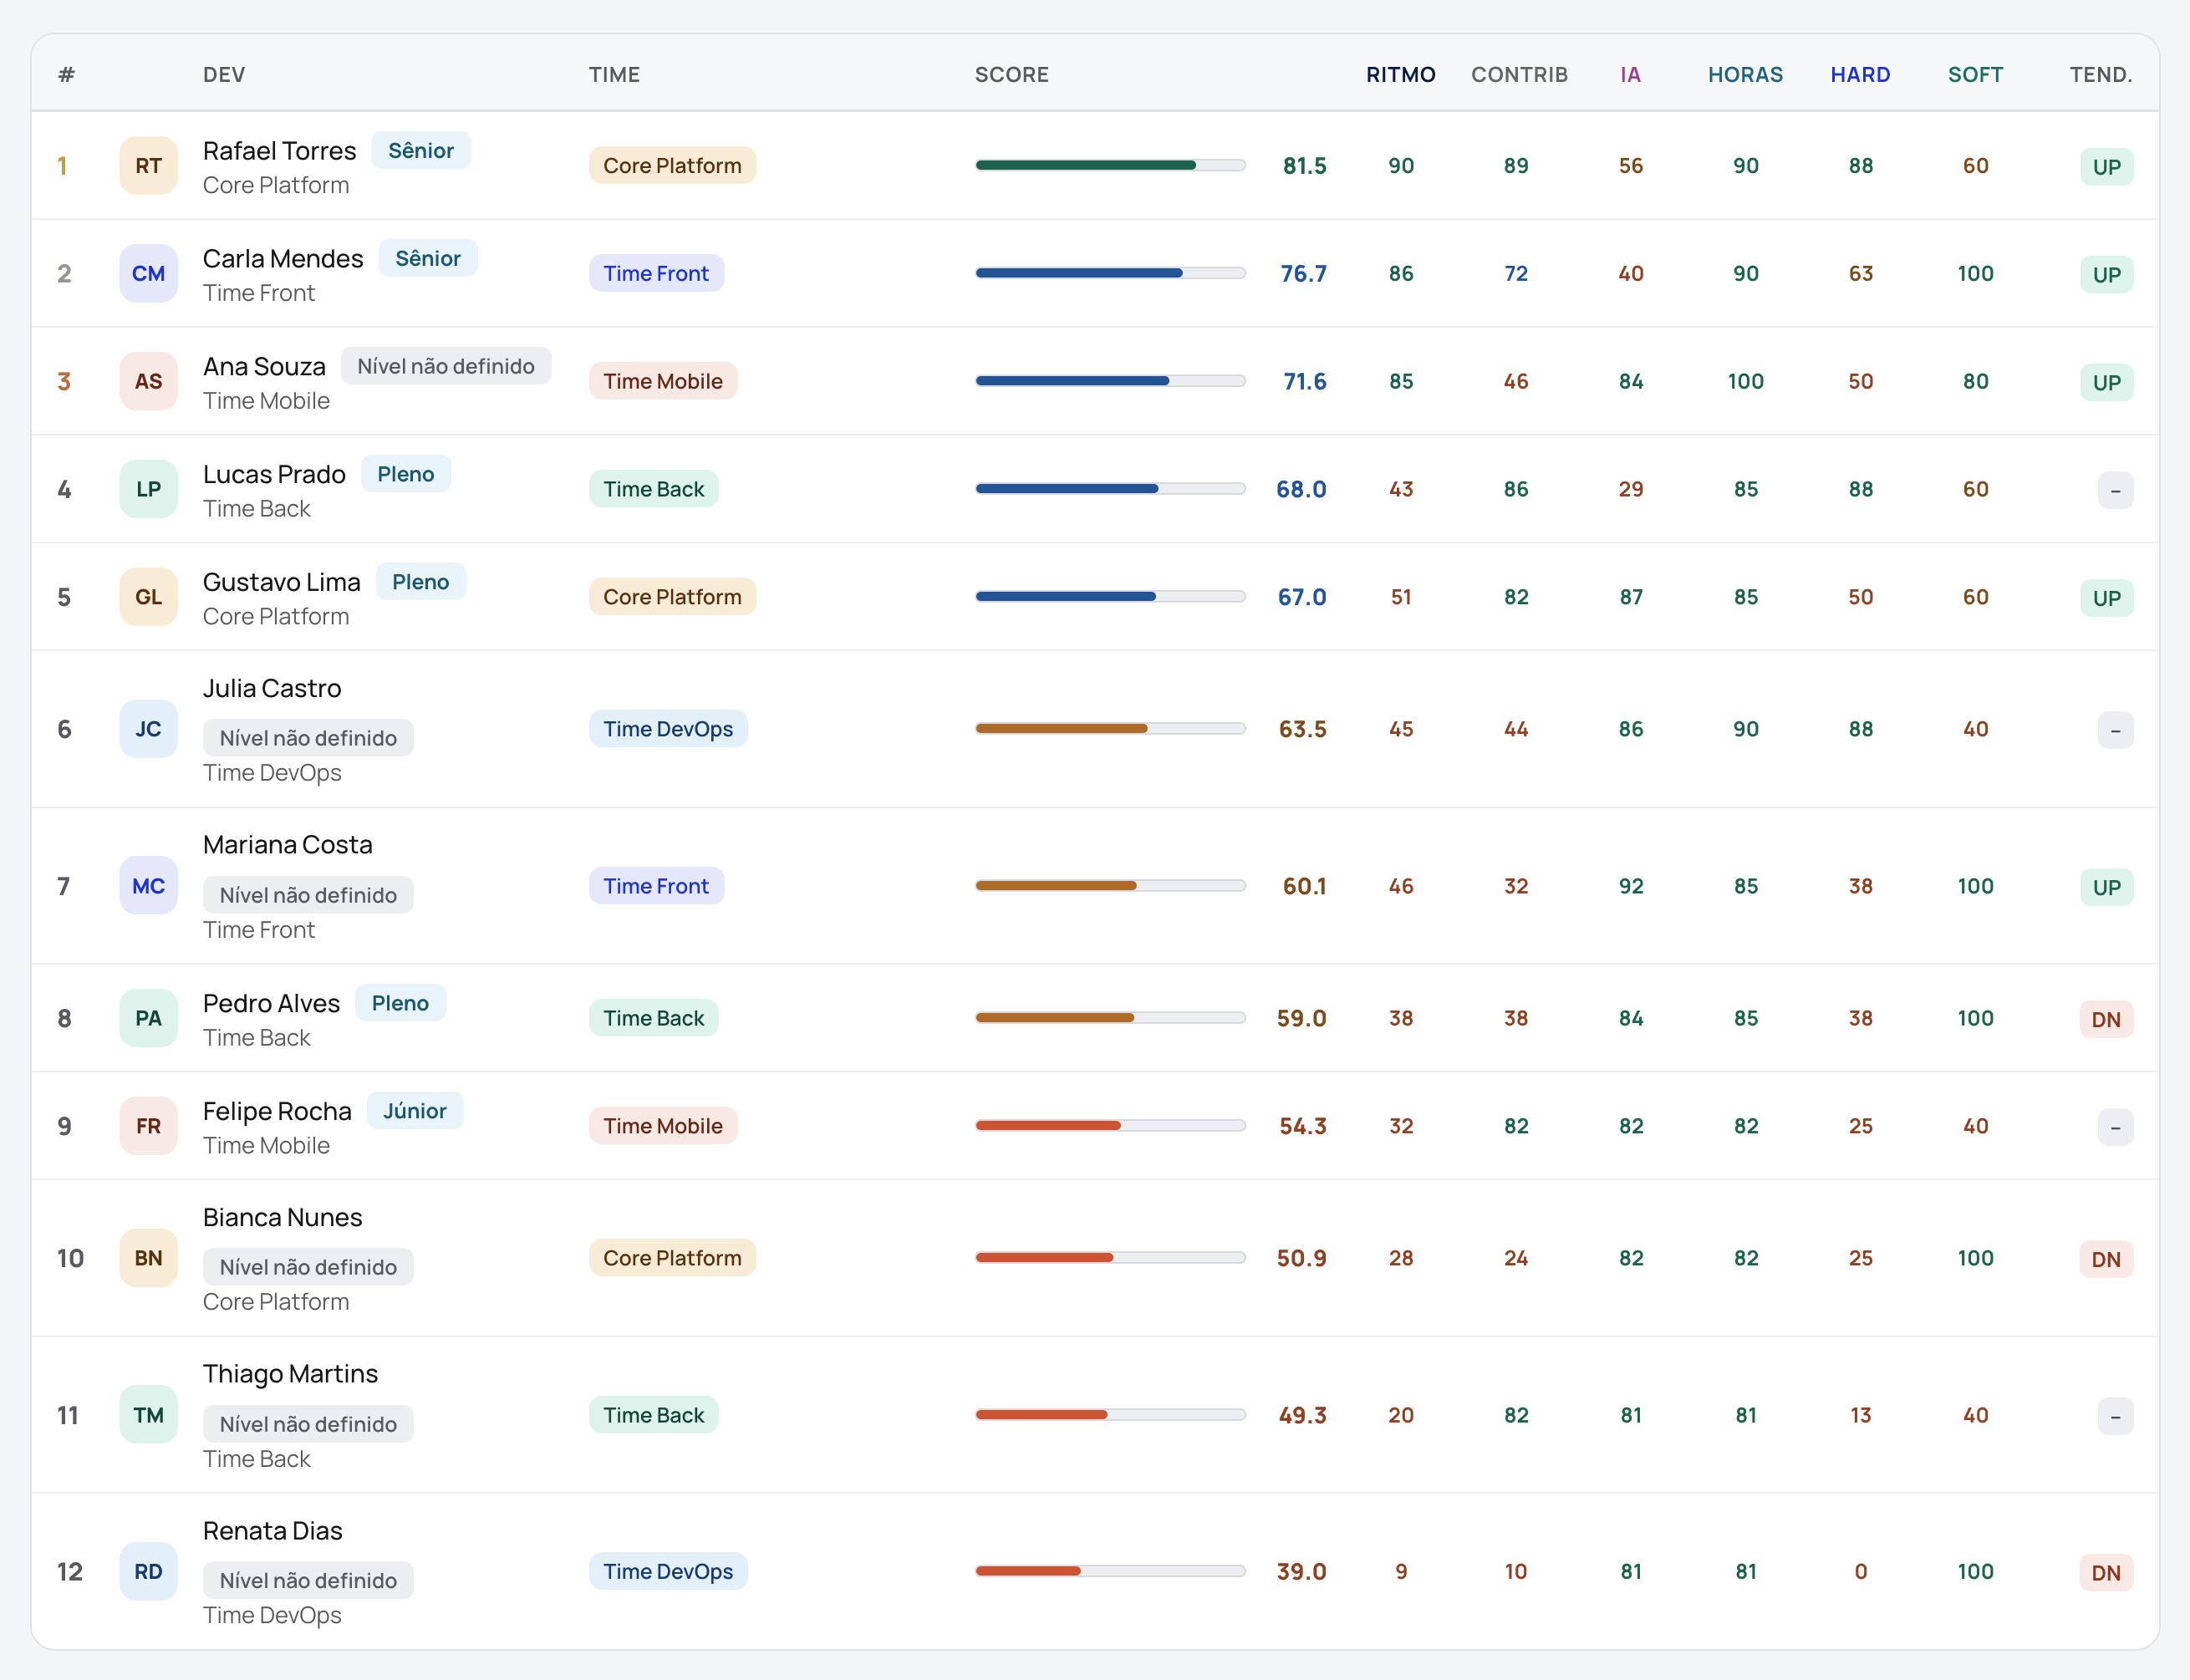
From the individual to the team: see where progress happens
Compare the health of each squad and follow the overall ranking by DevScore, with each person's trend at every close.
Built for those who manage people and those who manage systems.
Two readings of the same score. Select a profile to see the offer in detail.
- Biweekly trend, per person and per squad, in management language.
- An objective basis for 1:1s, development tracks and promotion conversations.
- Separates performance problems from data problems before any conclusion.
- A view of capacity and hours that connects cost, planning and execution.
- Git, hours and AI usage signals combined with leadership reviews.
- Caps per dimension: inflating commits, lines or hours does not raise the score.
- Operational health per squad: bottlenecks, drops and deviations visible early.
- Weights configurable per context, with change governance.
But how does Devint fit into my routine?
No new ceremony, no side spreadsheet. The score organizes evidence your workflow already produces.
1. Connect the sources
Git repositories, your time-tracking tool and AI tools come in as integrations. Leadership reviews are recorded directly in the platform.
2. Follow the cycles
Every two weeks, Devint consolidates the last four weeks into a score per person and per squad, with the composition broken down by dimension.
3. Make decisions with evidence
Drops and deviations become a starting point for investigation, not a verdict. The number opens the right conversation: a blocker, context, mentoring or reallocation.
Ready to see your team clearly?
Fill out the form and we'll book a demo of the DevScore applied to your context. Reply within 1 business day.
Prefer email? Write to [email protected]
FAQ
What is Devint's DevScore?
It is an indicator from 0 to 100 that combines six dimensions of development work: delivery pace, code contribution, AI adoption, logged hours, technical skills and collaboration. Each dimension has its own weight and is compared against healthy reference ranges.
Is the score a ranking among developers?
No. Devint compares each person against stable reference ranges, not against their peers. When the whole team improves, collective improvement shows up as collective improvement, without creating an artificial last place.
Can the score be gamed with artificial commits or hours?
Each metric has a healthy ceiling: above it, extra volume does not increase the score. The dimensions also cross-check each other, so inflating one signal does not improve technical reviews, collaboration or real contribution, and manipulation tends to leave a trail in code review and feedback.
Which tools does Devint integrate with?
Git repositories (such as GitHub, GitLab and Bitbucket), time-tracking tools and the AI tools the team uses. Manager and tech lead reviews are recorded directly in the platform.
How does Devint handle work that does not become code, such as architecture and mentoring?
Human reviews of technical skills and collaboration capture work that does not show up in automated metrics. Beyond that, the recommended reading is by trend and by composition, with context from leadership, rather than by an isolated number.
Latest content

Understanding Devint's evaluation dimensions
Automated signals, leadership reviews, weights configurable per role and reference ranges with a ceiling: how Devint reads each of the six dimensions of the work.

Approaches to developer evaluation — understanding the difference between models
Forced ranking, volume metrics, system frameworks, perception-based evaluation and absolute score: what each model incentivizes — and where each one fails.

The benefits of implementing a performance evaluation model for tech
Conversations grounded in objective data, problems visible earlier, predictable capacity and fairer recognition: what changes when tech is evaluated with clear criteria.